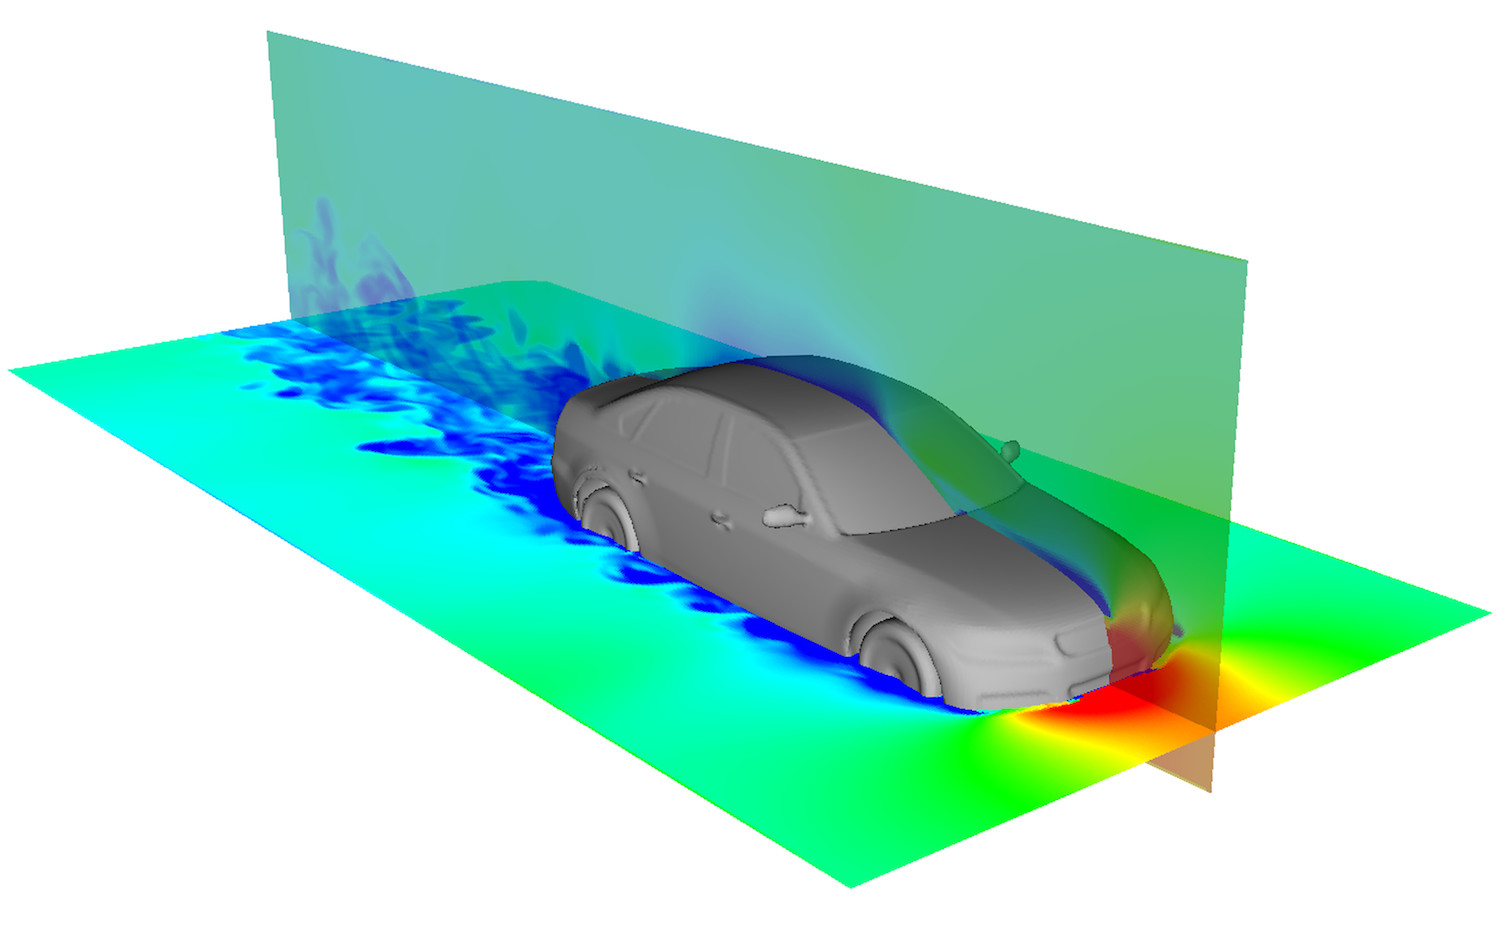
Density pseudocolour of a 100 m/s flow around the DrivAer geometry [1]
This work is part of my thesis "Computational Fluid Dynamics with Embedded Cut Cells on Graphics Hardware".
As part of my degree I researched speeding up fluid simulations on graphics hardware. The focus was on reducing the runtimes of CFD simulations with embedded cut cell geometries using the CUDA programming platform. The resulting software pipeline uses the Euler equations to model high speed flow and shock waves in domains with static rigid obstacles. These scenarios are applicable to anything from automotive and aerospace research to insurance assessment and mining safety. As the memory on a GPU is relatively limited, we also looked at the performance and scaling of multi-card scenarios using MPI for high resolution simulations.
At the core of the simulation implementation is a split Euler solver for high-speed flow. We use a one-dimensional method that achieves coalesced memory access and uses shared memory caching to best harness the potential of GPU hardware. Multidimensional simulations use a framework of data transposes to align data with sweep dimensions to maintain optimal memory access. Analysis of the solver shows that compute resources are used efficiently.
The solver was extended to include cut cells describing solid boundaries in the domain with a compression and mapping method to reduce the memory footprint of the surface information. The cut cell solver was validated with different flow regimes and we simulated shock wave interaction with complex geometries to demonstrate the stability of the implementation. Finally, we included a system of domain splitting and message passing with overlapping compute and communication streams. The complete software pipeline demonstrates good scaling for up to thirty-two cards on a GPU cluster.
Validation
The produced code has been validated against several exact and experimental results to show the correctness and accuracy of the software package. We can robustly handle low pressure scenarios, capture shock diffraction and reflection in high speed flow as well as model stable steady state at lower speeds.
To validate the 2D cut cell code, a subsonic flow around an aerofoil was simulated. Once the simulation has run to steady state and all strong waves have dissipated, the pressure coefficient values along the surface of the aerofoil can be compared against experimental readings.
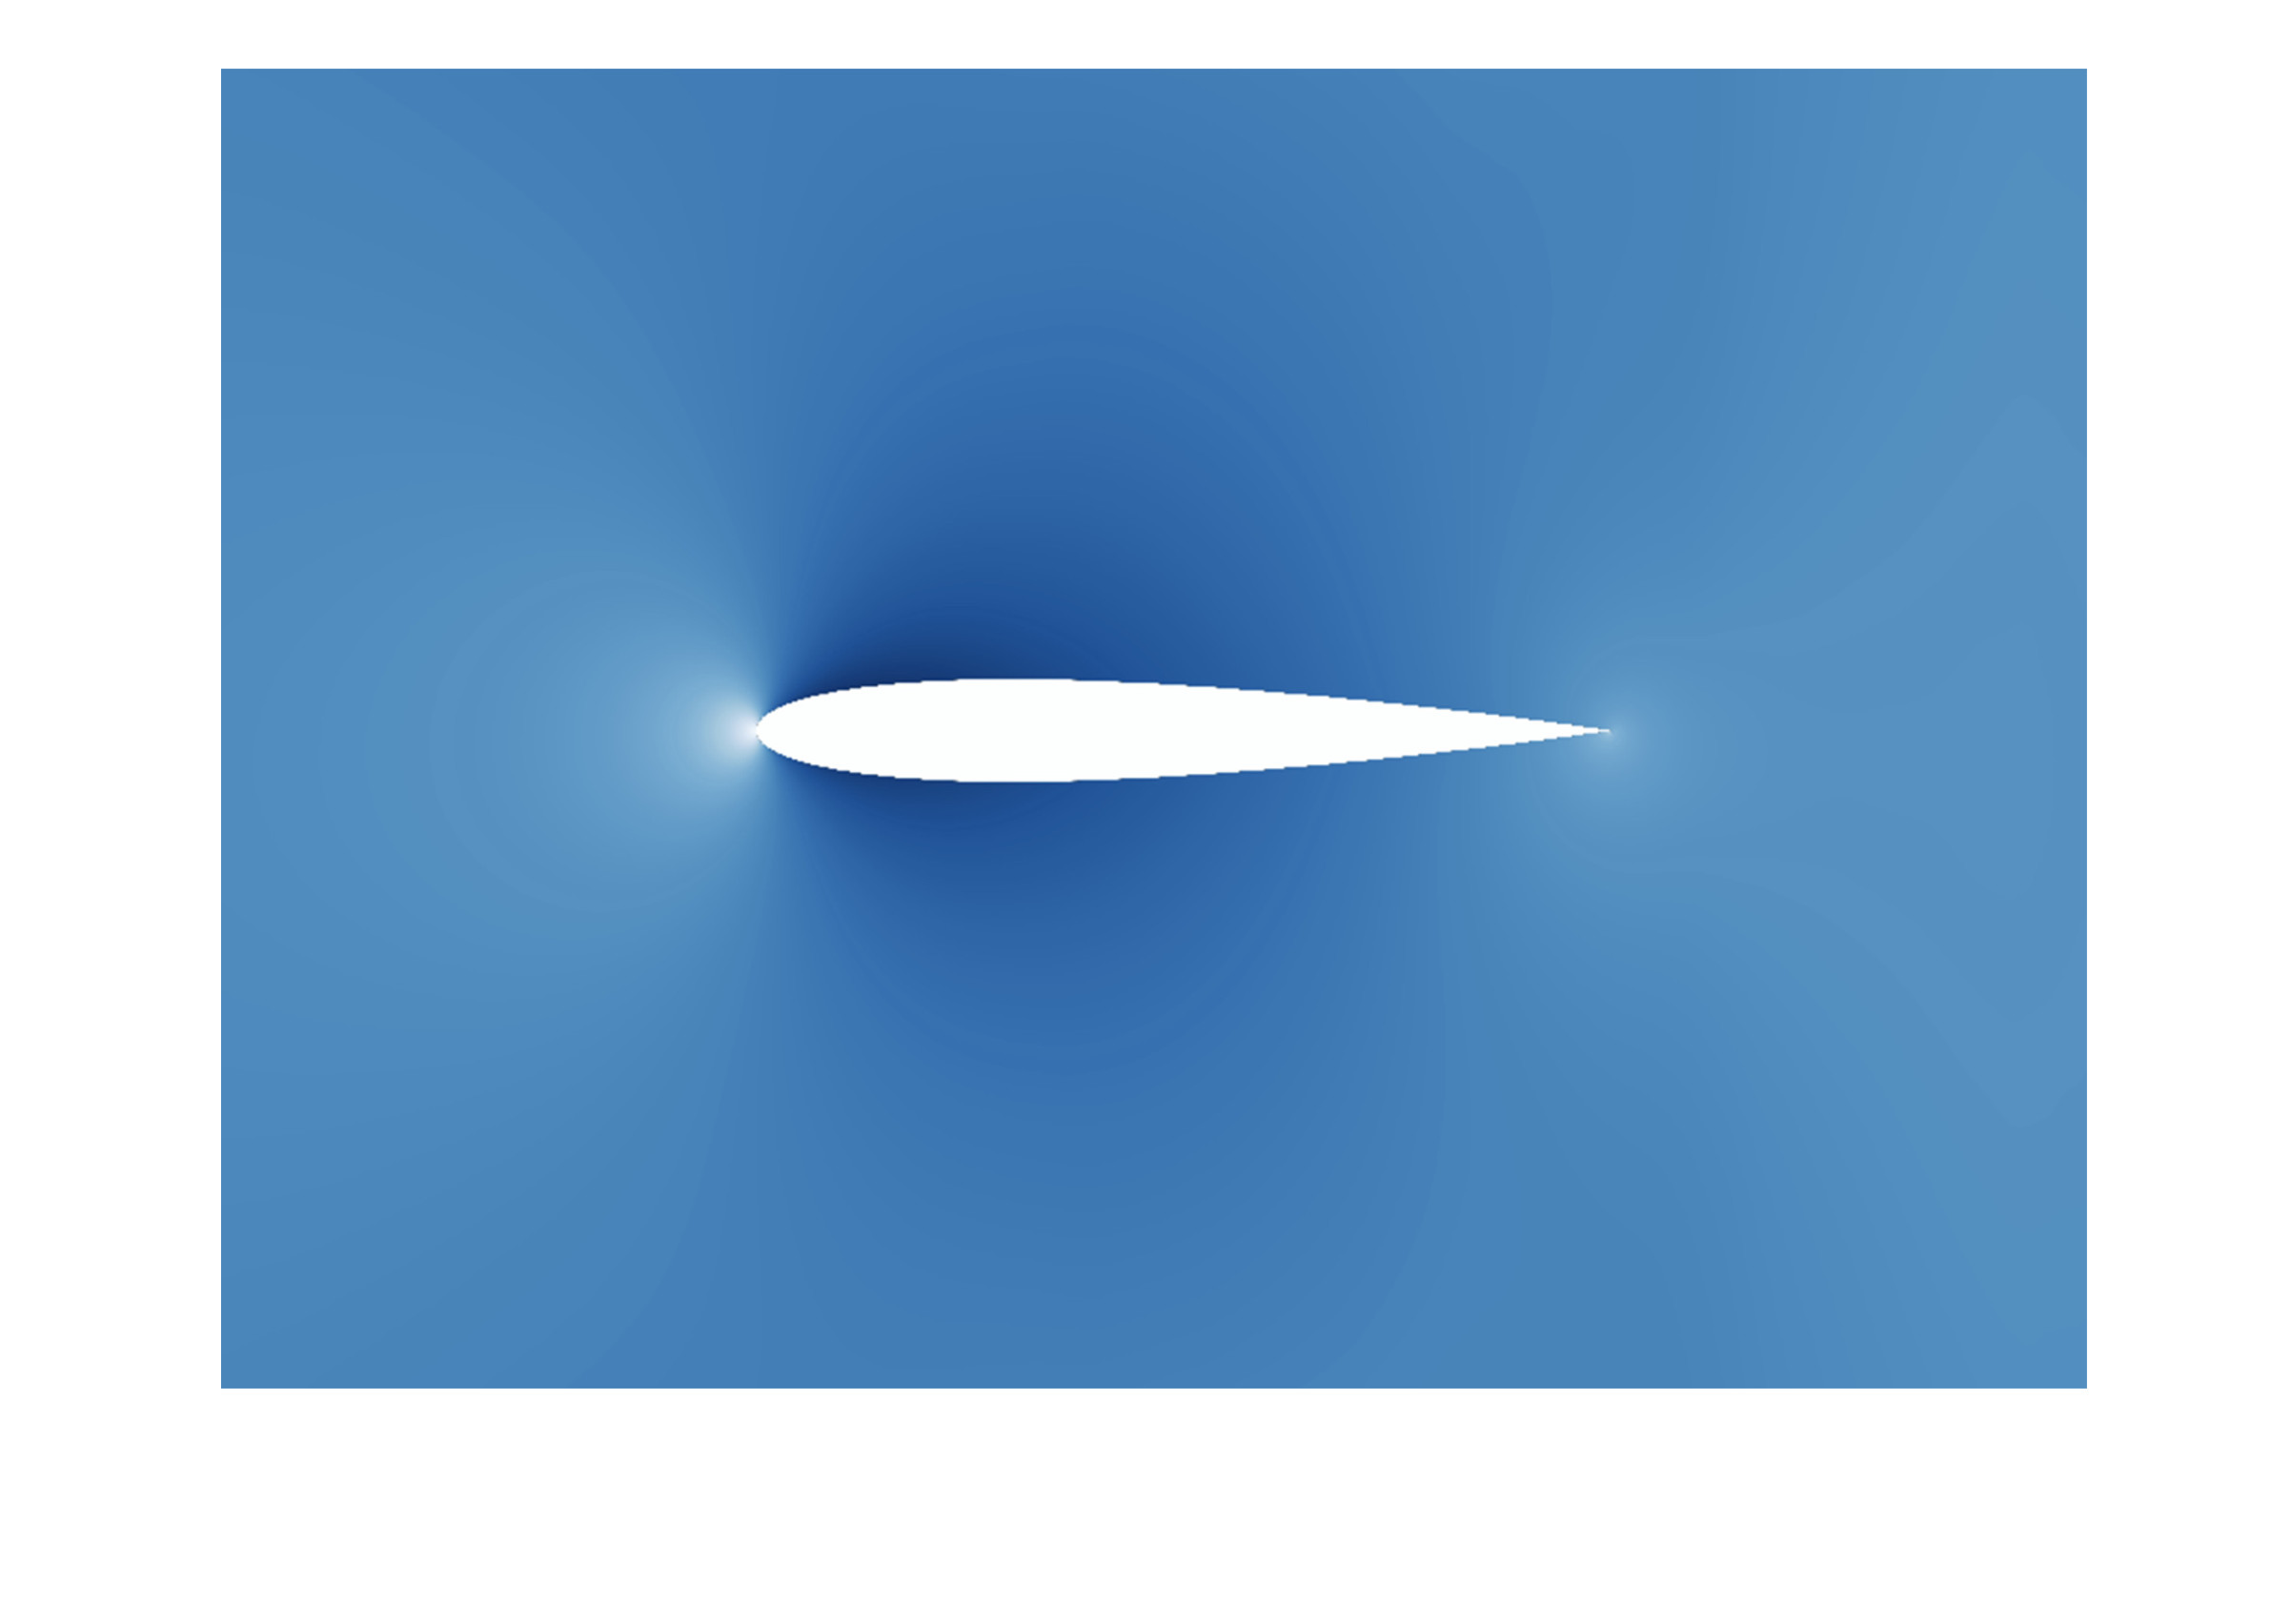
Pressure pseudocolour at steady state
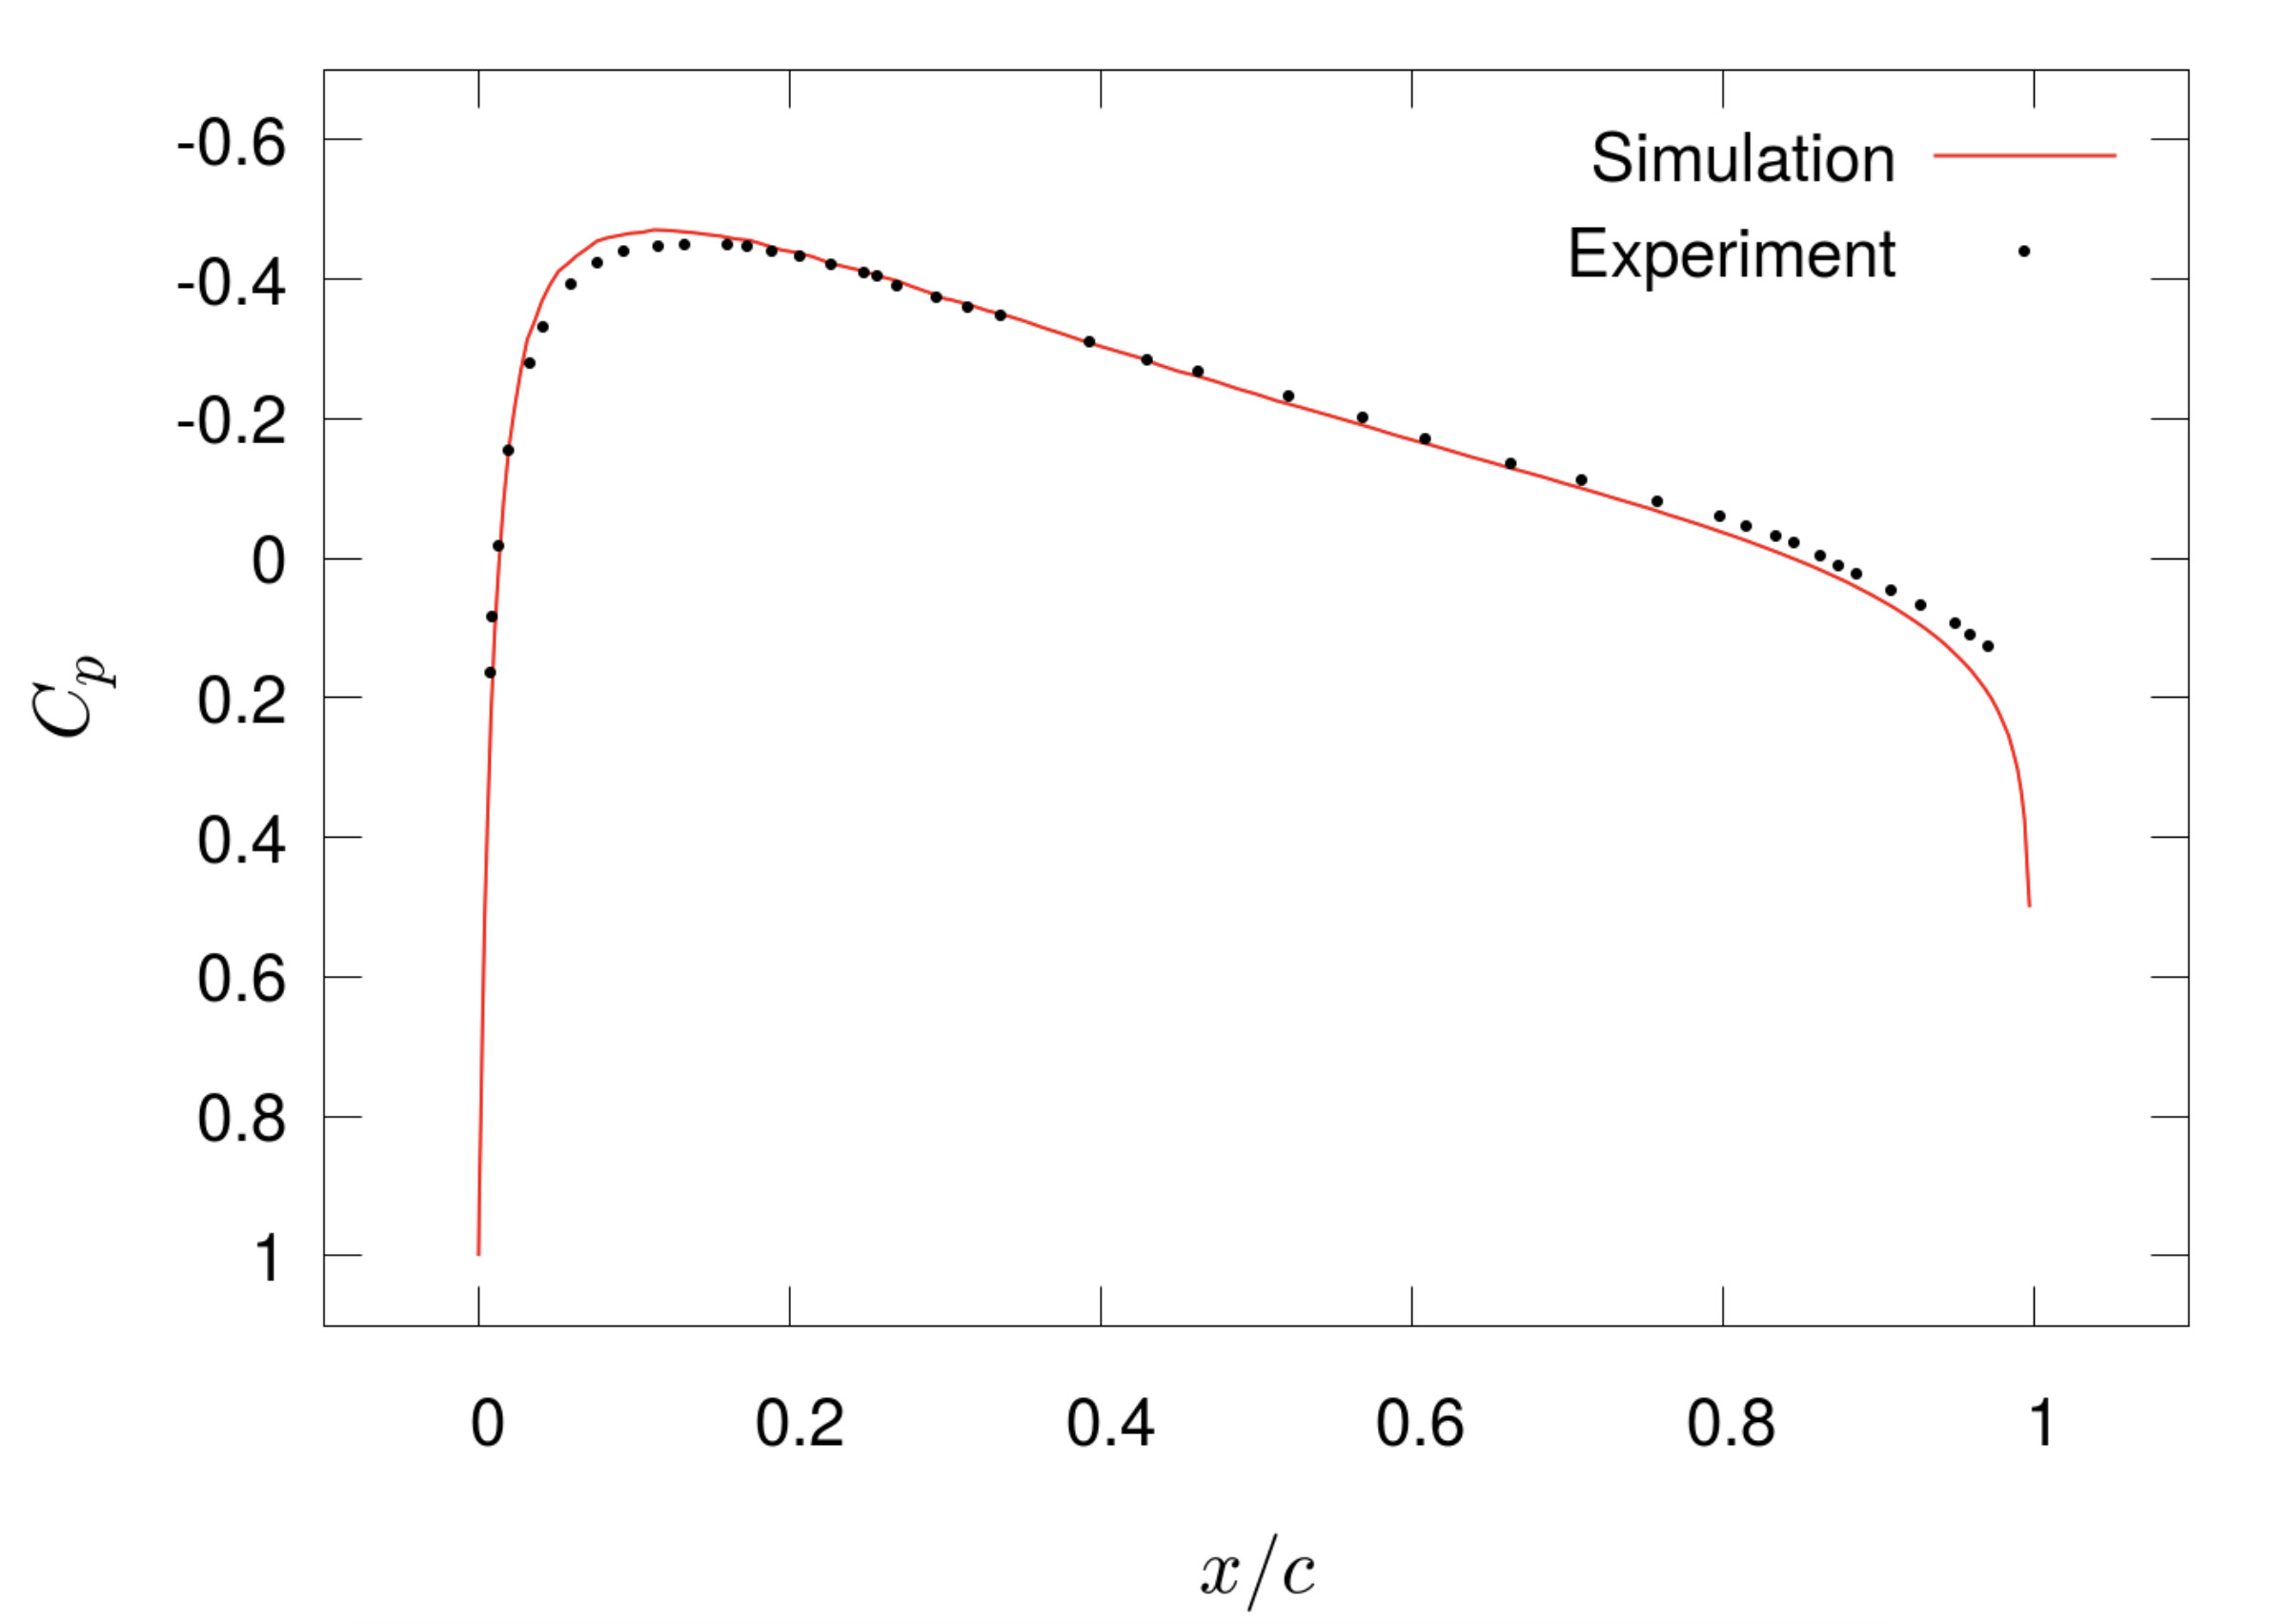
Pressure coefficient results
Results of a Mach 0.4 ideal gas flow over a NACA 0012 aerofoil at t = 0.015 s with experimental [2] and simulation pressure coefficients Cp at x-coordinates along the chord length c of the aerofoil.
For 3D validation, we used the Brittle scenario [3] which models a detonation in an irregular street layout. The resulting propagation and reflection of shock waves serves as a validation test for both the robustness and accuracy of the simulation when compared to sensor readings from physical experiments.
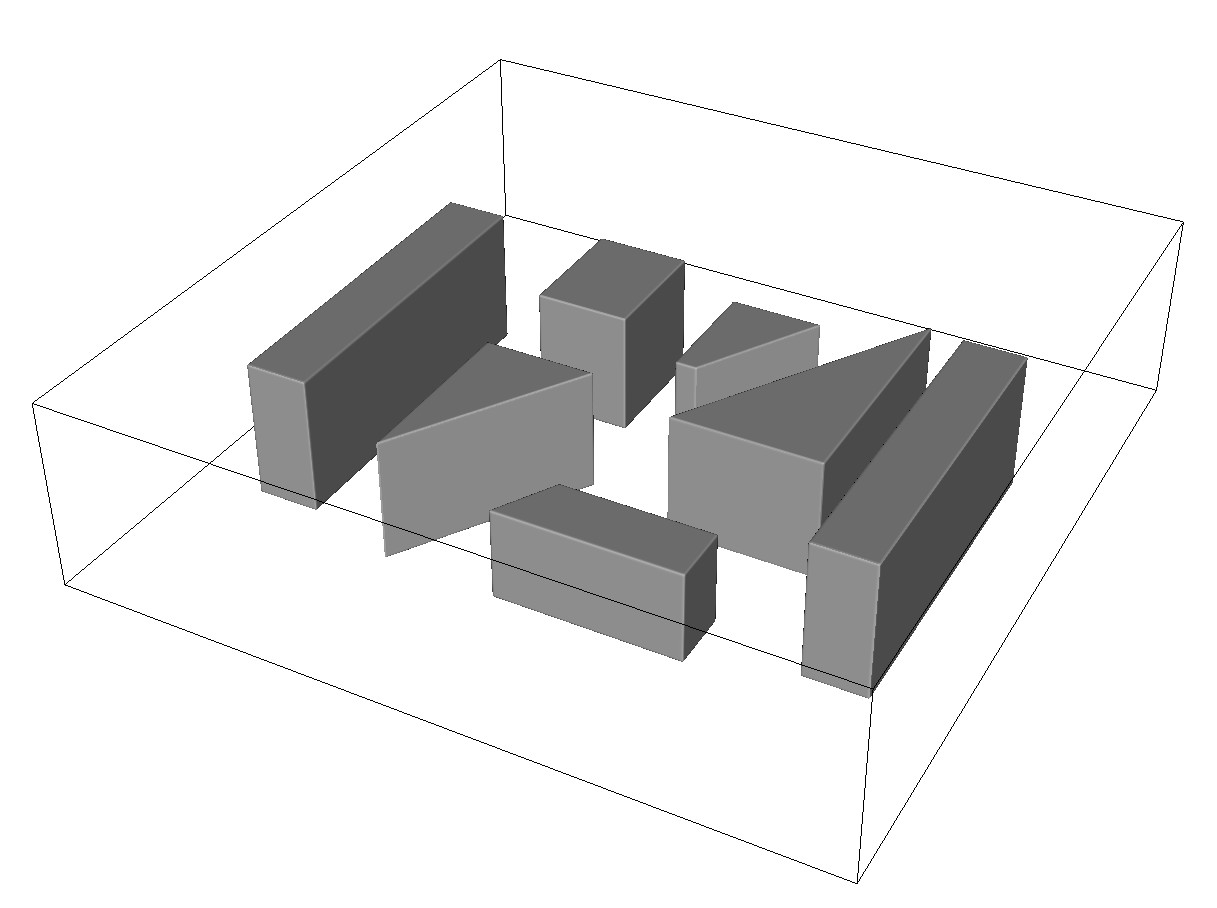
The geometry layout of the Brittle test case
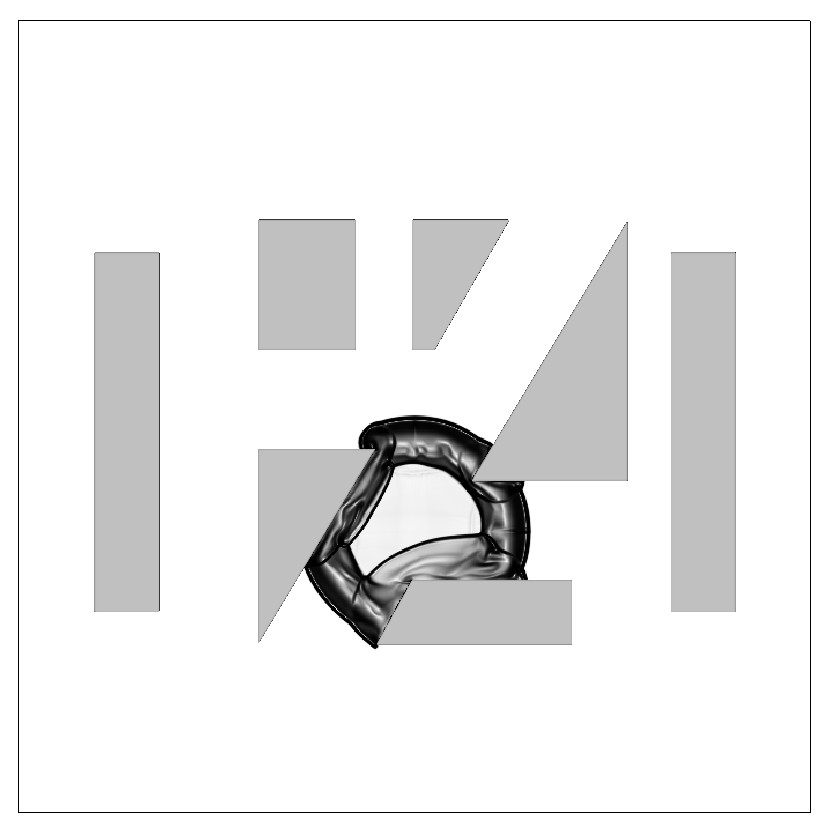
Numerical Schlieren slice of detonation after 200 timesteps
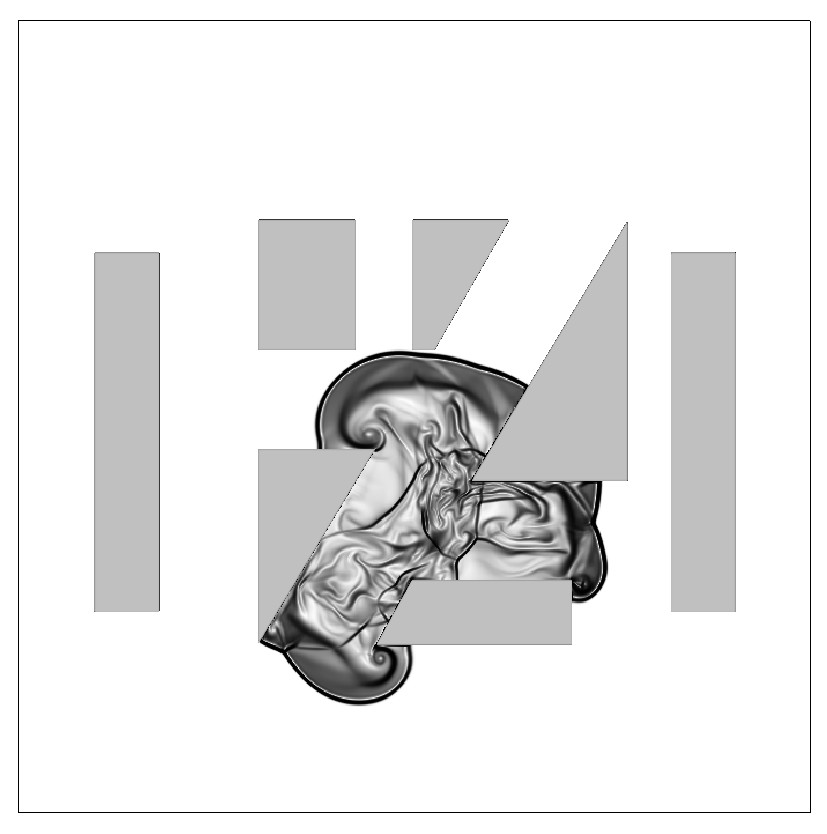
400 timesteps
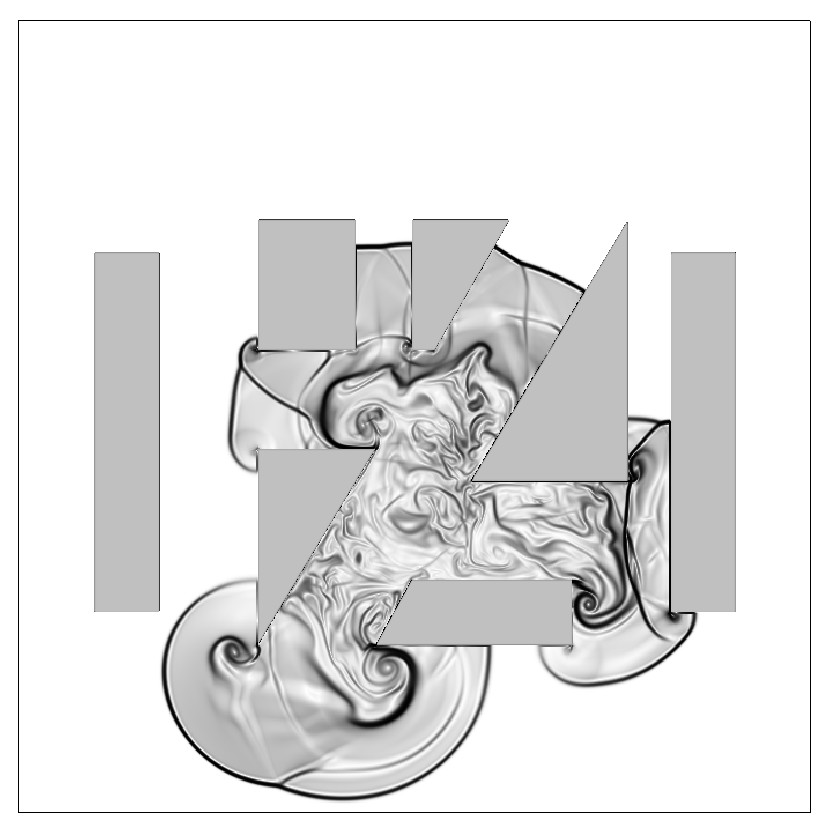
800 timesteps
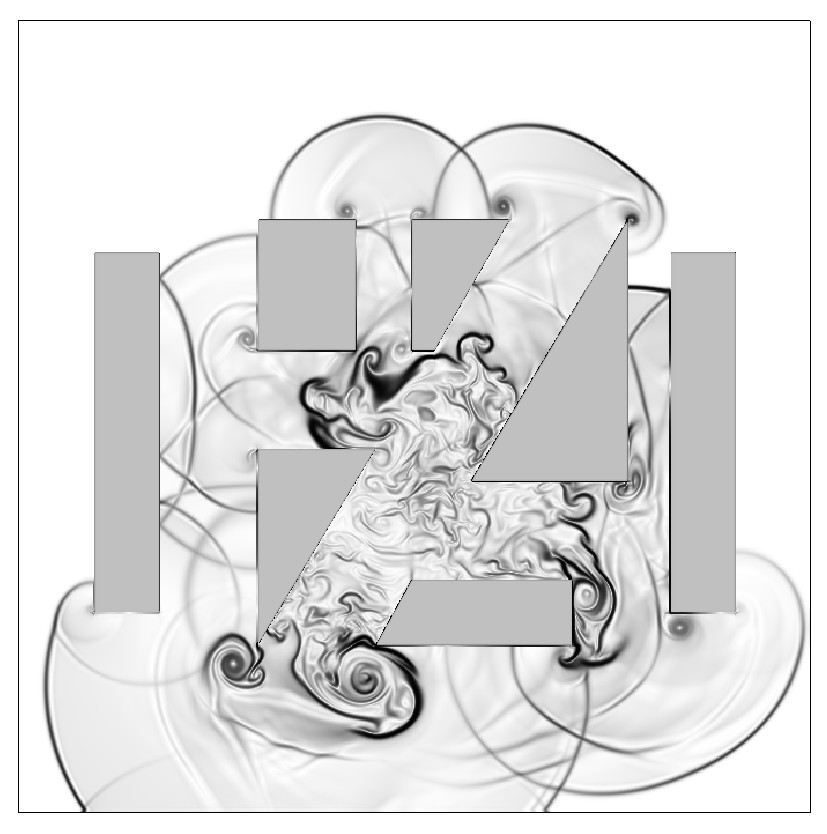
1200 timesteps
Overpressure readings of several simulations spanning multiple card counts compared to experimental results [3]. The measuring point is obscured from the charge location and shock waves pass over and around buildings resulting in reflections and channelling which serves as a good test for the software.
The stability of the methods and the robustness of the software was tested with shock waves within complex geometries where both pressure peaks and near-vacuum conditions can occur.
Mach 2.0 shock reflected from the DrivAer geometry. The produced software can robustly handle high pressure at various surface features such as concavities and thin solid area
Performance
The software aims to minimise the proportion of time spent on communication. In a multi-card simulation, halo exchange is required to find the information propagation across local subdomain boundaries. CUDA allows for computation to occur simultaneously with communication between device and host. Additional parallelism can be achieved by overlapping kernel execution with MPI communication between nodes. To achieve this, every local subdomain is divided into three regions: the core cells and the communication cells. The core cells can be solved independently from MPI communication of the ghost region data and we mask most message latency.
Regions of a local subdomain
Accumulated exclusive time per function group
The pie chart shows the proportion of different function types across the whole simulation on four Nvidia Tesla P100 cards. The Kernels portion is the solver code which dominates the runtime. The CUDA section is for memory copies to and from cards and the MPI portion is communication and synchronisation.
The scaling of the software on a single card is shown in table 1. We list the number of steps and the time taken to simulate a Mach 2.0 shock wave travelling around a cone to a fixed final time using different resolutions. We also show the number of cut cells in the domain.
| Resolution | Cut cells | Steps | Time(s) |
|---|---|---|---|
| 85 x 85 x 85 | 2,890 | 396 | 6.6 |
| 170 x 170 x 170 | 12,124 | 815 | 91.9 |
| 340 x 340 x 340 | 48,200 | 1,688 | 1,404.1 |
Table 1: 3D shock over a cone on an Nvidia Tesla K20 card at increasing resolutions.
The scaling of the code over multiple cards and compute nodes was tested with fixed resolution bubble collapse (425 × 425 × 850) and Brittle (640 × 640 × 320) simulations on a cluster with four Nvidia Tesla P100 cards per node. The clear solver scales excellently for all card counts, demonstrating the efficiency of masking communication time with domain splitting and overlapped solvers. The cut cell simulation scales worse due to a larger message size, but is comparable to the clear solver for up to eight cards.
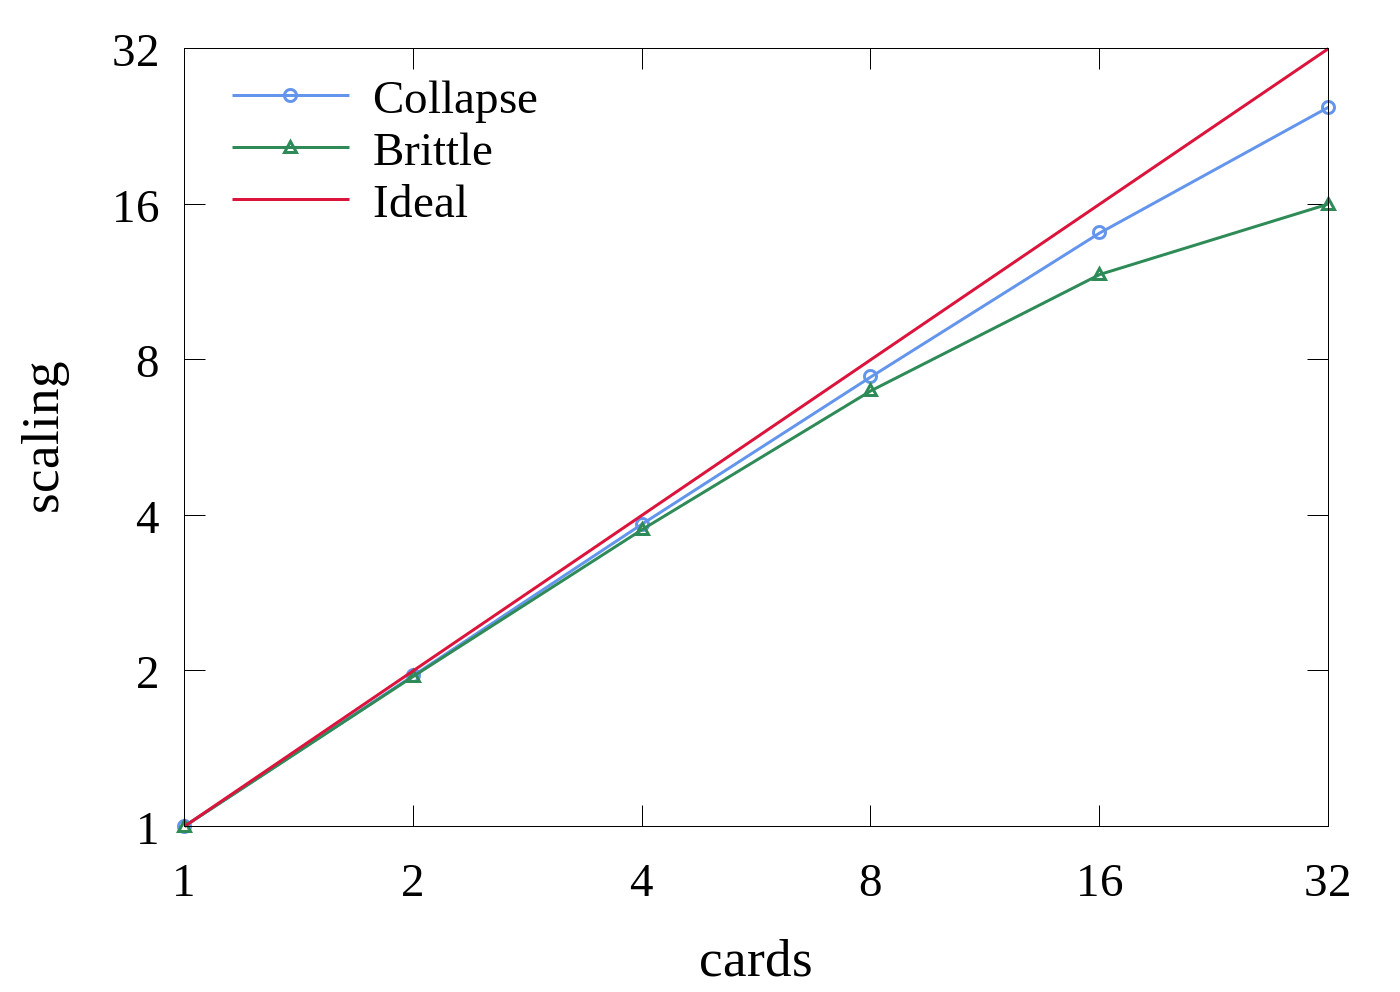
Scaling of 3D bubble collapse (425 × 425 × 850) and Brittle (640 × 640 × 320) simulations.
- DrivAer model
- Amick, J. L. (1950). Comparison of the experimental pressure distribution on an NACA 0012 profile at high speeds with that calculated by the relaxation method. Report, National Advisory Committee for Aeronautics
- Brittle, M. (2004). Blast propagation in a geometrically complex urban environment. Master’s thesis, Royal Military College of Science